State Economic Monitor
INTERACTIVE DESIGN / DATA VIZ
Project overview
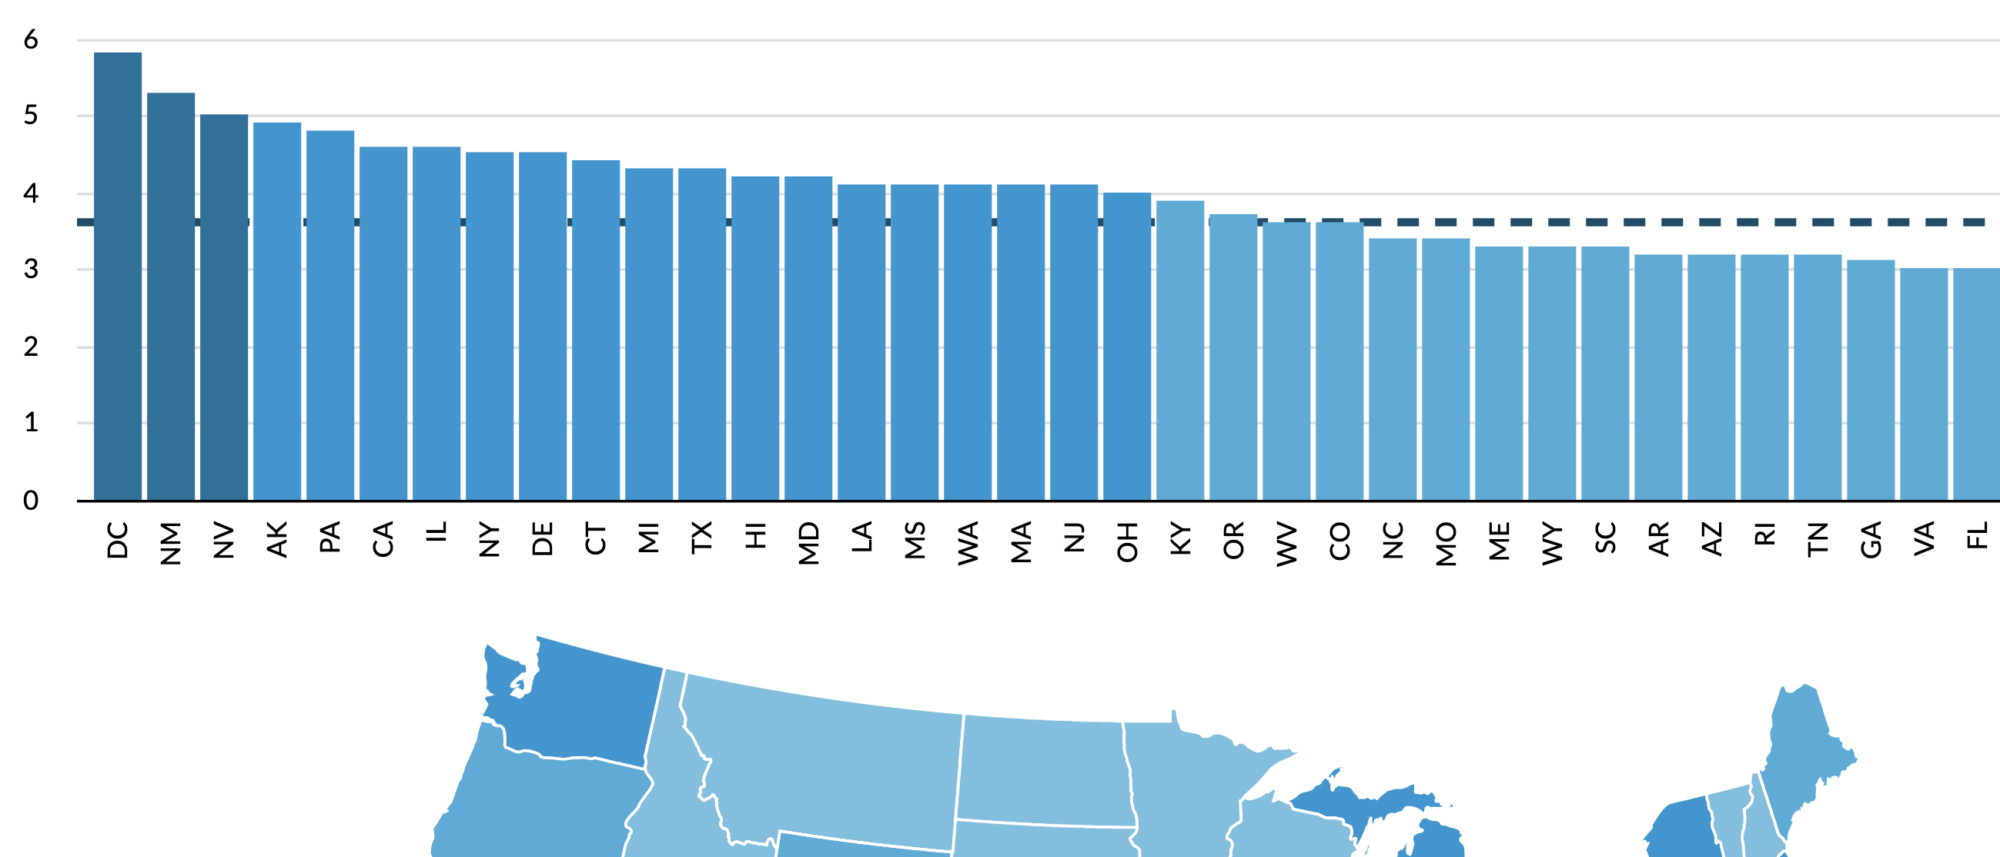
State Economic Monitor tracks economic and fiscal trends at the state level. The site highlights differences across all 50 states and the District of Columbia in employment, earnings, housing, and taxes. I worked on the first iteration of this tool and loved jumping back in to reimagine how SEM could be enhanced. The improved presentation gives the user more ways to see the data, greater control and provides audience engagement opportunities at the start of the interactive.
Surfacing relevant data
The data is refreshed regularly and with those updates we surface interesting or noteworthy stories in the data. The highlight “cards” link to the charts below, illustrating the specific trend noted and promote audience engagement on social. This pattern is a direct result of understanding how our users engaged with the product.
Allowing the user to build their story
This tool allows the user to select a timeframe and a range of indicators to display the economic trends. Having the ability to save customize the presentation of data and then save the chart has been a popular improvement.


