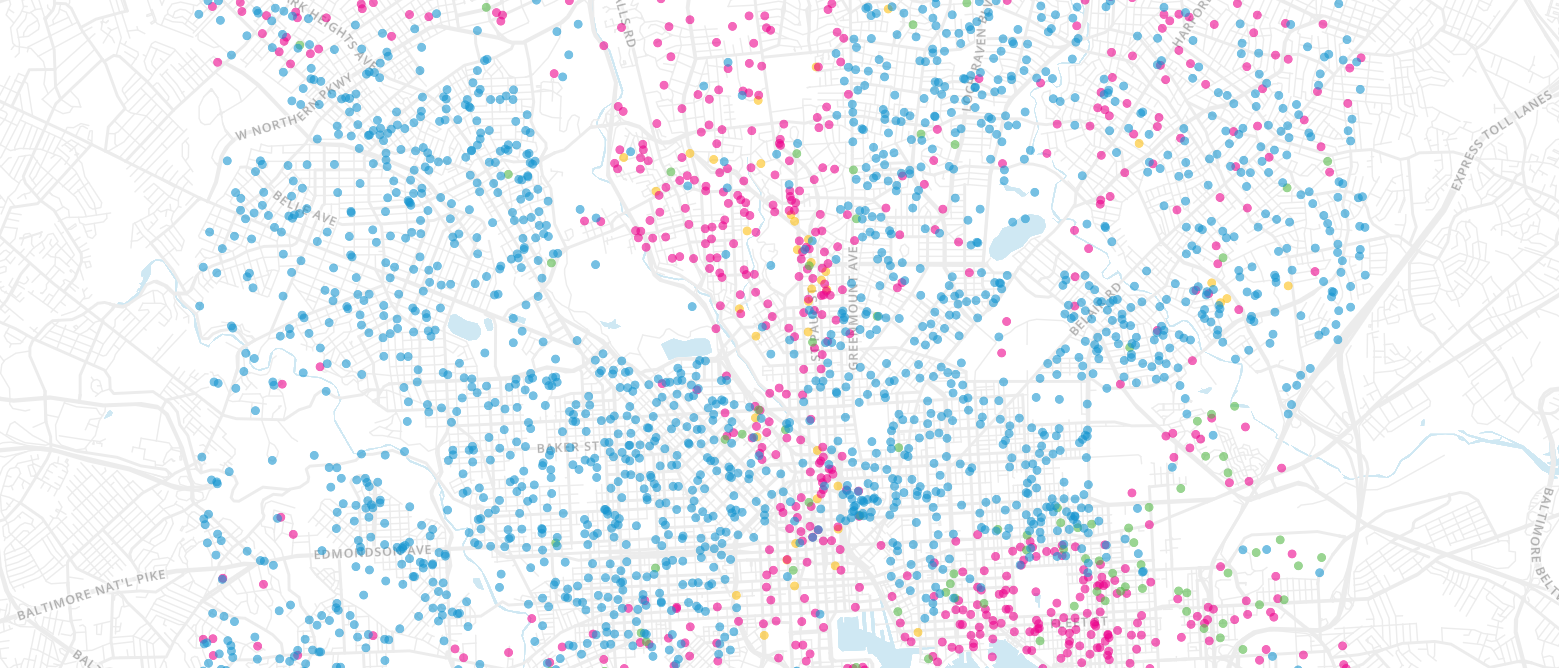
Black butterfly
INTERACTIVE DESIGN / DATAVIZ
Project overview
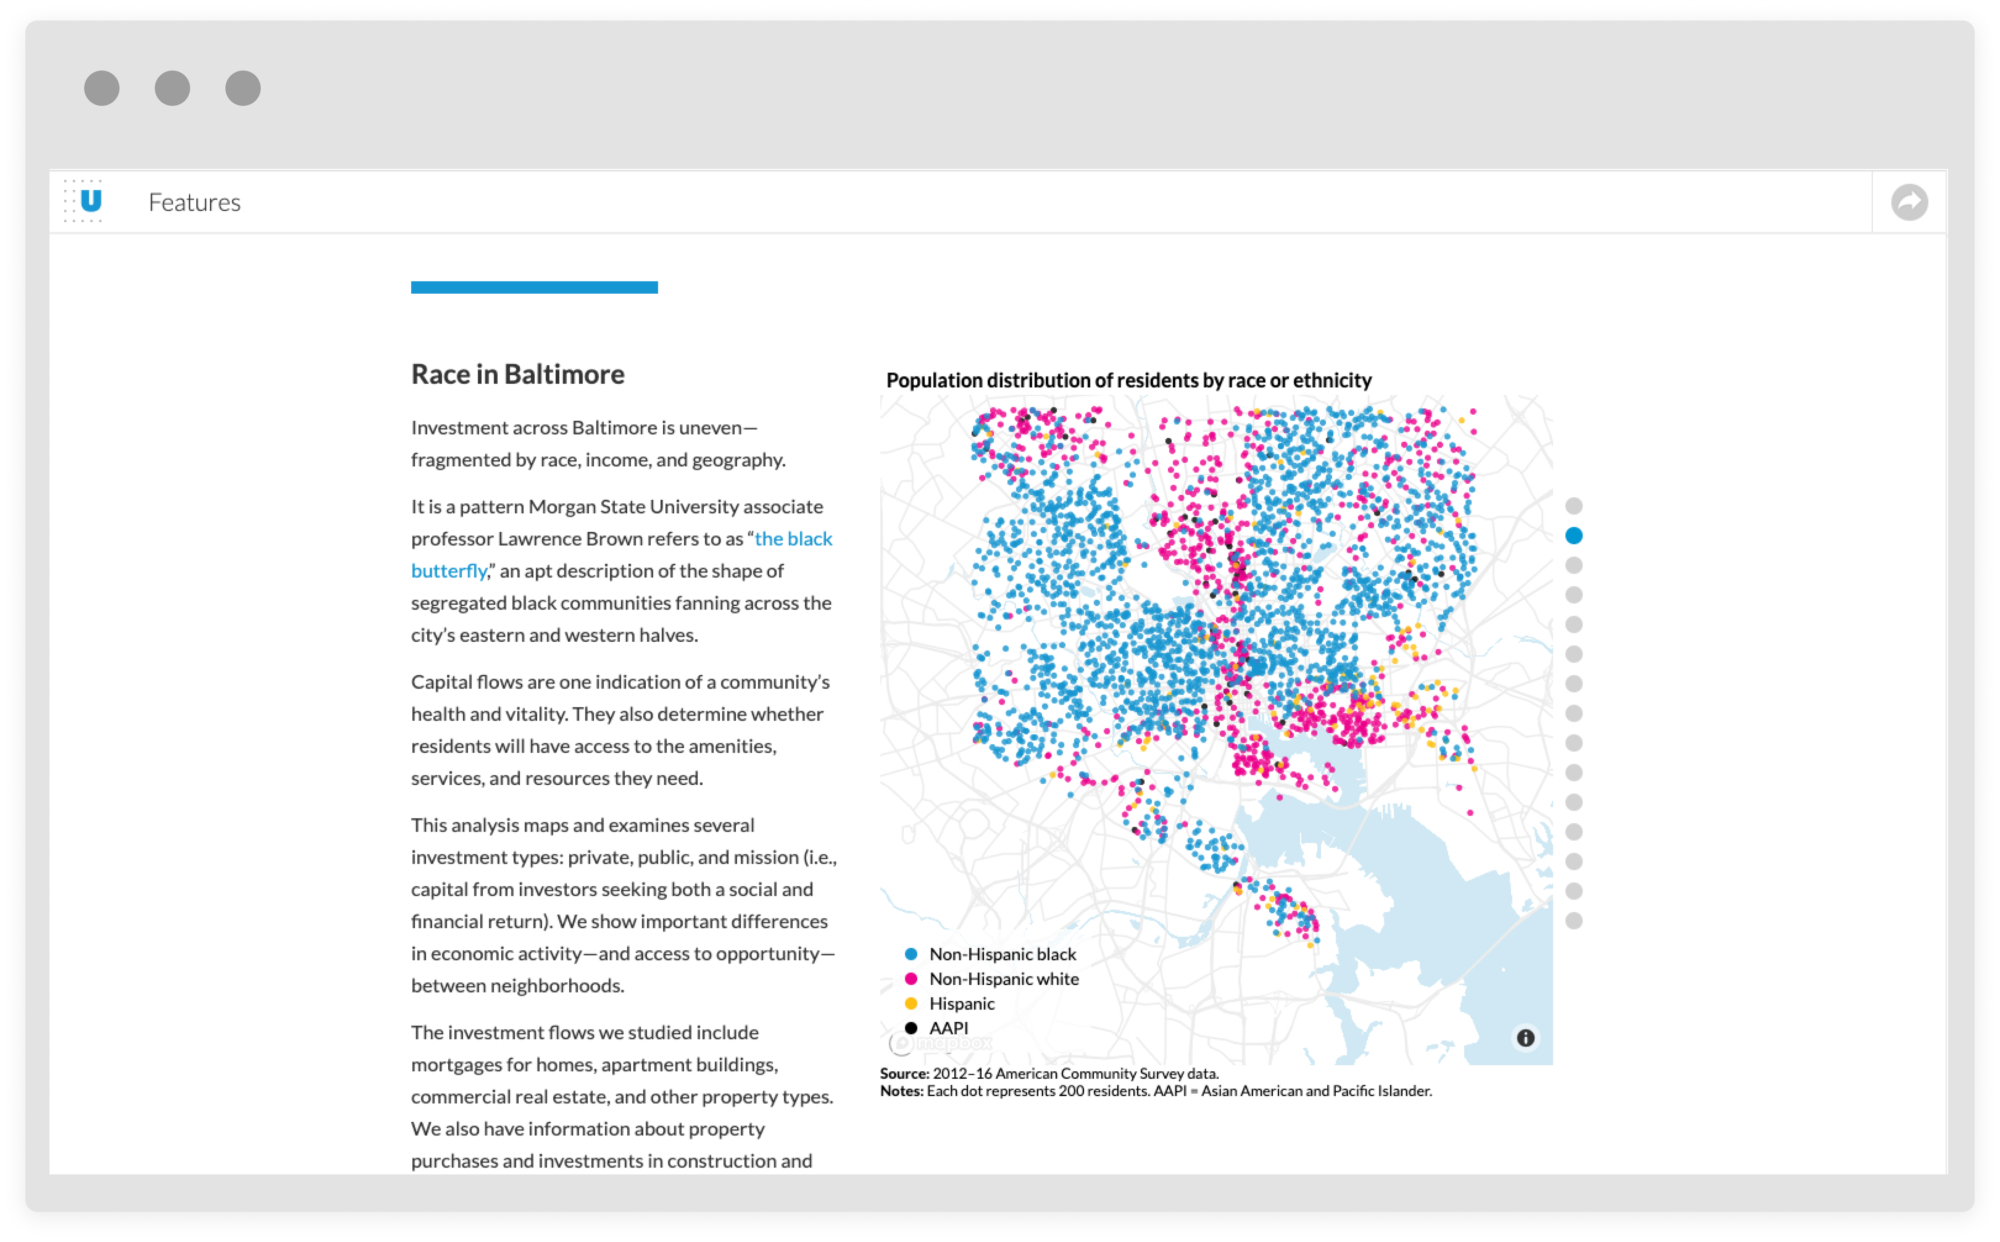
An explanatory data presentation on investment patterns in Baltimore and the impacts of racial segregation. The project is broken into focused sections with data and text placed side-by-side to tell the story. Clear charts and a straightforward story this piece had wide spread media pickup when it was launched and continues to be referenced in articles years later.
A complex story made digestible
the feature focused on clear storytelling - short sections and simple charts to describe the landscape of Baltimore. This presentation made the data approachable for the intended audience.
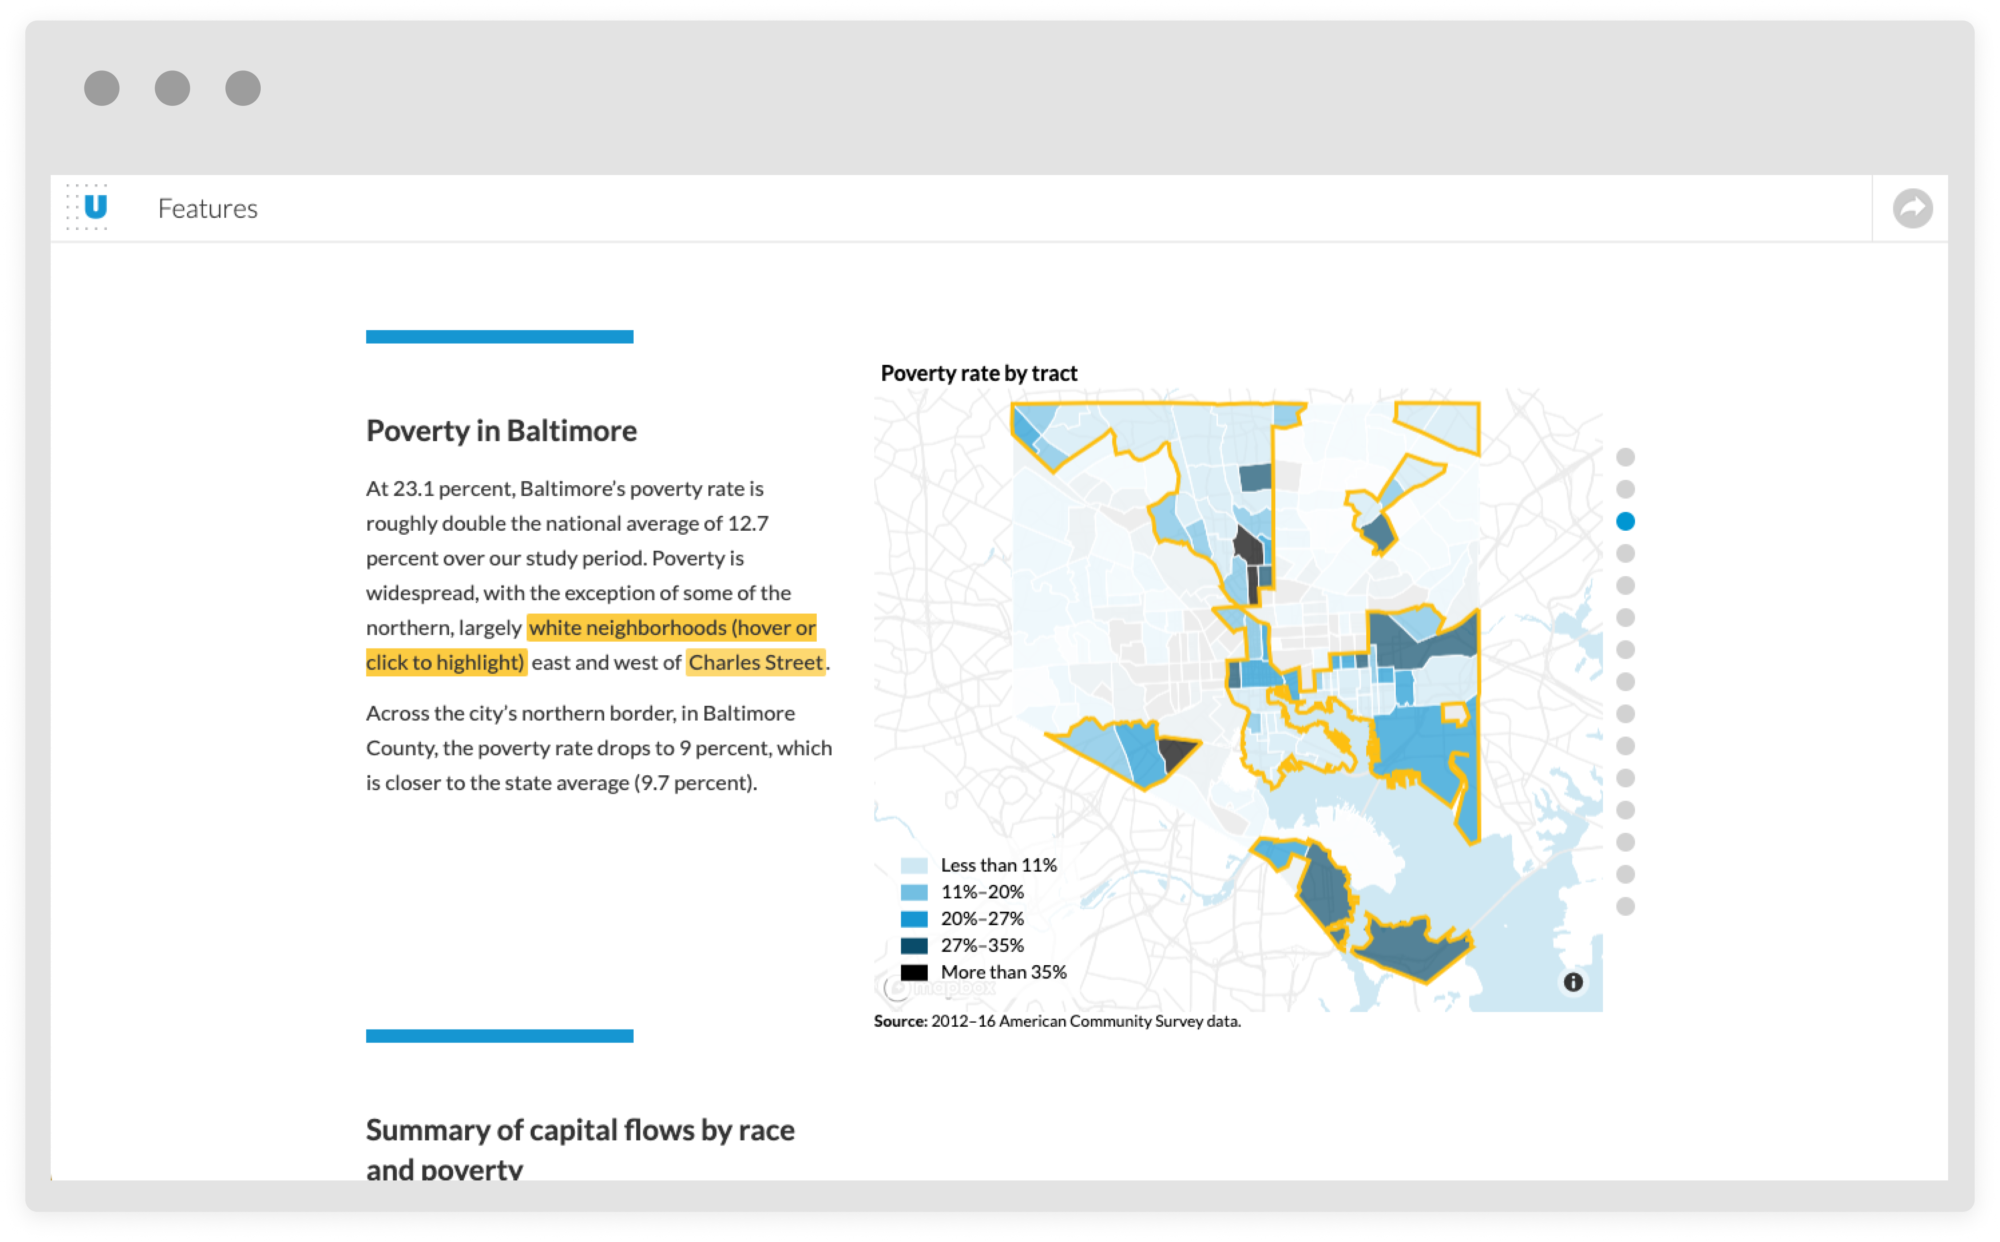
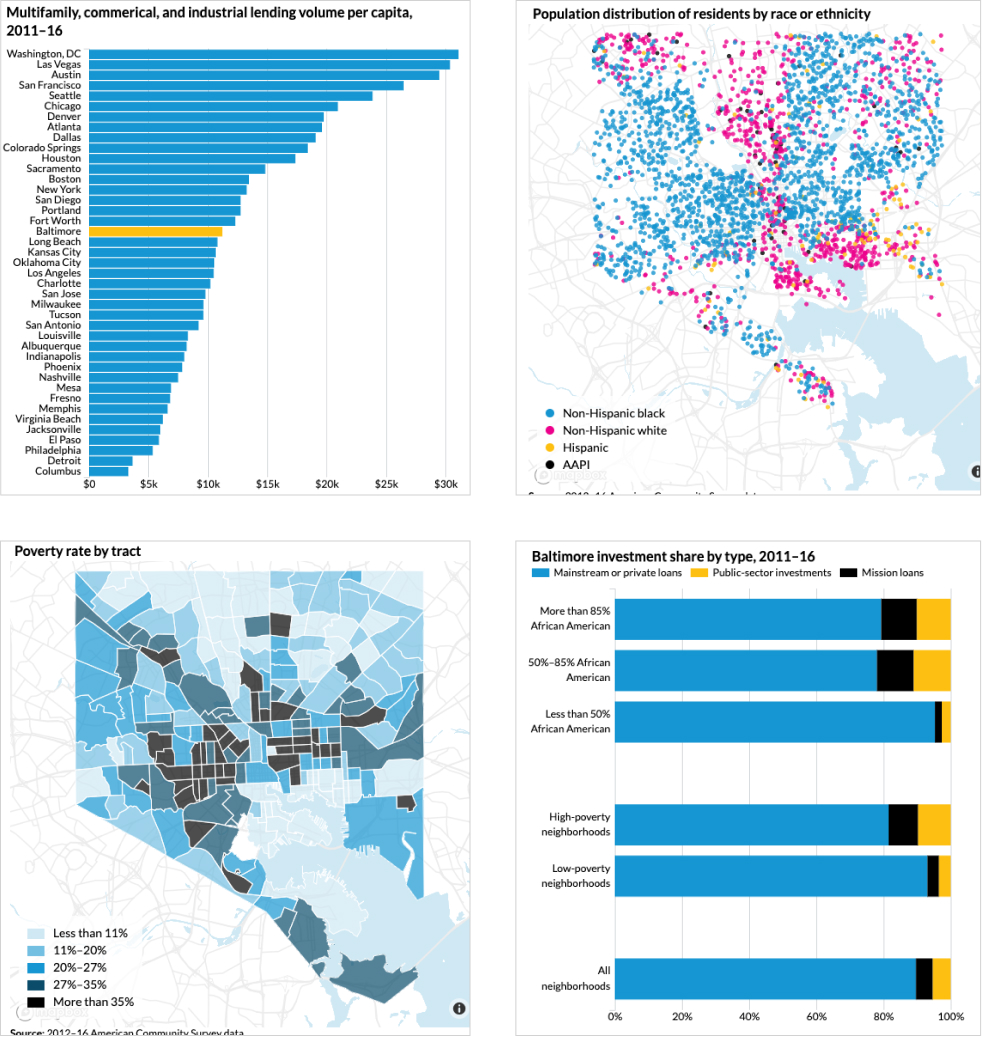
Simple, straight forward charts
When working with data it can be exciting to build complex presentations to communicate ideas. In this case we were able to achieve the objective by harnessing the power of simple and effective dataviz. Most of the graphics were static and each section had a point and that point was supported by the text and charts.